Tuesday, 10 September 2019

Current and future challenges for water resources management

I was recently asked to present on the current and future challenges for a water resources manager to address. We have seen a great deal of change and progress in how we plan for water resources in England over the last decade. This blog post summarises some of the key challenges I highlighted in my presentation.

Join the discussion as part of Theme 6 on Water Resources and Large Scale Water Management at the IWA World Water Congress in Copenhagen (October 2020 - see call for papers here).


Pressures on water resources

We face increasing pressures on water resources from climate change, population growth and the need to protect the environment. The latest summary of these pressures has been provided by the National Infrastructure Commission's 2018 report Preparing for a drier future: England’s water infrastructure needs. This sets out a 1 in 4 chance of serious drought between now and 2050 and that emergency options to address this could cost £40 billion vs £21 billion by taking a strategic approach. The Water UK Long Term Water Resource Planning Framework also highlights that there is an increasing risk of more frequent and intense droughts across England and Wales, not just in the South East.


Current challenges

Regulatory complexity and planning

We face a complicated policy and regulatory landscape when it comes to management of water resources. This is summarised by the figure below from Ofwat's Water 2020 report and since its publications there are further government policies linked to the 25 Year Environment Plan (e.g. biodiversity net gain) and new plans such as Drainage and Wastewater Management Plans that will have implications going forward for water resources management. Water companies face many tensions around meeting the objectives of Defra, Ofwat, the Environment Agency, CCWater and other government bodies. Additionally, the timeframes for planning are still not aligned.


In the latest planning period there has been greater consideration of the links between drought planning and long-term water resources management plans (WRMPs). An increasing level of complexity has been introduced into the water resources planning process. This is set out in the 2016 UWKIR report WRMP 2019 Methods - Decision Making Process: Guidance. Taking a risk based approach enables selection of the most appropriate methods for individual water companies. However, many of the more advanced processes may be less transparent and can be hard to communicate to customers and wider stakeholders. We need to keep sight of outputs and visualisations as decision making tools for planners and stakeholders to engage with, not as the ultimate output themselves. This was an issue I commented on in a blog post in 2016 when the WRMP guidance was published.

Resilience


Resilience to climate change and drought is a major factor in water resources planning. However, increasingly we are seeing the need for wider resilience to be addressed around changes to peak demand linked to hot weather. June 2018 was the driest June since 1925, with a rainfall total for England of only 15 mm. In England, United Utilities applied for a hosepipe ban, then called it off. In Northern Ireland a hosepipe ban was implemented for three weeks. In Scotland, the sustained dry weather and heatwave conditions in 2018 resulted in less water availability and an increase in customer demand. In some areas this was an additional 30% of demand and led to Scottish Water producing an additional 140Ml/d (Water Efficiency Strategy for the UK Year 1 Report).

The freeze-thaw incident of March 2018 resulted in more than 20,000 homes in London being without water due to pipe bursts and the wider impacts across the network of this increase in water demand. Many of the issues faced in terms of planning and customer engagement were similar to those that have been experience during times of drought. I wrote about this in a blog post for the WATEF network. What this incident highlighted was that many of the customer engagement lessons and recommendations from the 2012 drought had still not been implemented.

Competition and markets

In May 2019 Ofwat wrote to incumbent water companies and highlighted their desire to see development of more effective markets. These include developer services (e.g. self-lay networks), upstream water resources options and working with water retail companies who now supply non-household customers. Although water companies have released detailed information on their water resources requirements with their WRMPs there has been very little uptake by third party providers. Ofwat recently consulted on this "bilateral market" for water resources. Although we have had new appointments and variations for some time now, where an alternative water company to the incumbent can supply to a new development, this hasn't been as successful as in New South Wales in Australia where a similar regulatory regime has enabled new semi-autonomous water schemes within Sydney (see previous blog post).

One of the benefits of moving to retail competition for non-household customers identified in the Cave Review (2009) and the Water Act 2014 was greater levels of water efficiency. Research (link to report) early in the first year of market opening observed a limited range of services being offered. Ofwat's report on year 2 of the market highlights that "water efficiency measures has been slow to
develop":
  • Around 0.3% of customers who switched since market opening report leakage control services as a benefit of switching
  • Only 4% of customers who had renegotiated since market opening report water efficiency services as a benefit of renegotiating
  • "on the basis of customer interest and in view of a number of possible barriers to take up, that there remains untapped potential for continued development in the offer and take up of water efficiency services"
The ongoing challenge for water resources management will be working with retailers to enable demand forecasting as well as cost-effective options for delivering demand management in partnership (Water Efficiency Strategy for the UK Year 1 Report).

Regional water resources planning

In the lead up to WRMP24 a National Water Resources Framework group and further regional water planning bodies have evolved. Their aim is to (link to WRSE newsletter):

  • Develop strategic plans that set out each region’s contribution to the national need
  • Deliver ‘nationwide’ resilience – and greater ambition on metering, leakage, and options to lower demand and new transfers flagged as necessary by the National Infrastructure Commission (NIC)
  • Enable greater collaboration through more consistent planning approaches and by identifying and removing existing barriers. 

The link between regional planning and WRMPs wasn't always clear in WRMP19 (something highlighted by Ofwat responses to draft WRMPs - see examples). This was the case for options such as water efficiency, where joined-up programmes at scale could be more cost-effective. A major benefit of this planning approach will be working across sectors, such as with industry and agriculture. As with WRMPs there will be a need to engage with water retail companies also to ensure that non-household demand and water efficiency options can be considered at a regional scale also.


Future Challenges

Abstraction licence changes and catchment management

Abstraction licence reform is progressing with pilot catchments and a bottom-up focus rather than the legislative changes that have been proposed previously. By 2021 the programme aims for (see presentation at CIWEM Water Resources Conference 2018):

  • 90% of surface water bodies and 77% of groundwater bodies at the required standards 
    • RSA programme completed
    • 2,300 time limited licences reviewed 
  • 10 licensing strategies detail solutions for the most affected catchments (all updated by 2027)
    • Solutions to remaining environmental pressures 
    • Improving access to water
  • A new and consistent regulatory regime and a modern service
    • Clearer access to vital data (such as flows and licence details) 
    • Simpler processes
This will support water companies with licence trading, regional planning and flexible licence changes (e.g. during drought situations). Catchment management to address water resources quantity rather than just quality aspects will also be an area that may be picked up by regional planning approaches.

Demand management

Water efficiency

With common performance commitments as part of Ofwat's PR19 business planning process on water use, leakage and drought resilience there should be a greater business focus on demand management than in the past. The NIC report suggests 34% of the resilience gap can be met by demand management. However, this focusses on metering alone and there are still large savings that can be made through produce labelling, building standards and behaviour change programmes.

Defra are consulting on a range of measures including personals water consumption targets, incentives and smart metering. Water efficiency labelling combined with product standards and building regulations could reduce consumption by 30 litres per person per day within 25 years. Additionally, water companies need to engage with customers on climate change and population growth issues linked to rising consumption and to support working with them individually to help meet PCC targets. Smart metering is a key tool to provide the feedback on consumption to enable individual targets to support water company wide reduction in water consumption.

A recent experience of implementing water use percentage reduction targets can be seen in California. A report “Making Water Conservation a California Way of Life” identified that targets resulted in a 33% reduction in water use (Gallons per customer per day - equivalent to PCC).


Leakage

An average target for leakage reduction of 17% by the end of 2020-25 across all companies in England and Wales has been reported for PR19 draft determinations. This represents a significant challenge around technology and innovation to achieve this reduction, especially when the total reduction achieved in the last year was just 0.4% (Figures from WWT Databank, Vol 62, Issue 9). This is a major area of collaborative research focus in the UK via UKWIR with their strategic question "How will we achieve zero leakage by 2050 in a sustainable way?".

Transitions for resilience

A new approach will be needed to support resilience to climate change, the wider pressures of population growth and the need to protect the environment. A successful approach to this has been applied in Western Australia using a security through diversity model. CIWEM's 2018 position on planning water resources recommends "Adoption of a ‘security through diversity’ approach to managing water resources":

"CIWEM advocates a strong commitment to the twin-track approach, moving towards a more
formalised ‘security through diversity’ approach. This should assess demand management
and new resource options alongside water recycling, water transfers and trading. These
options should be assessed on a long-term economic basis, taking full account of
environmental and social cost and benefit." 


The culture in water companies in relation to risk and innovation is steadily changing. However, in WRMP2019 many plans set out household and neighbourhood rainwater harvesting and SuDS options as being too risky to implement. We will need to see more examples of integrated water management in future. Smaller neighbourhood schemes can act as decentralised semi-autonomous nested supplies within our cities that can help address resilience issues and provide a transition between centralised and decentralised approaches. A good example is in North West Cambridge (link to video), however this is unique in terms of the university acting as a developer. Anglian Water and others are looking at how incentives through developer charges may support greater uptake of water reuse.


Links with business planning and customer outcomes

Increasing engagement will be required when developing plans and considering options (as has been the case across the last several price reviews). Water resources options, especially those based on demand management or integrated water management can have large impacts on CMeX and DMeX . Water companies will need to work across the business to deliver performance commitments and Water UK work on public interest.


Conclusions

I've outlined above some of the current and future pressures faced by water resources managers in England.

  • We are facing increasing pressures on water resources
  • There is increasing complexity of water resources planning and regional engagement
  • Transitions are required for resilient water supplies and wider sustainable water management (addressing flooding, water quality etc.)
  • These challenges are opportunities to improve outcomes for customers, the environment and business
Moving into PR24 there will be greater room for innovation in planning and delivering water resources as part of the wider social contract between water companies and customers. Water is a key medium through which we feel the impacts of climate change and recent declarations of a climate emergency need to take better account of this.

Join the discussion at IWA World Water Congress 2020

The call for papers, workshops, forums and training is open until the 30 October. Theme 6 is calling for papers on water resources and large scale water management, including:

Groundwater

  • Groundwater mapping, monitoring and modelling
  • Protection of groundwater quality and quantity
  • Soil contamination and groundwater remediation
  • Governance, management and institutional arrangements

Surface Water

  • Surface water monitoring systems and models
  • Protection of surface water quality and quantity
  • Source-to-sea pollution management
  • Pollution from point sources – agriculture, industry, urban
  • Diffuse pollution – sources and mitigation
  • Water-related ecosystems and environmental flows

Integrated Water Resources Management

  • Water stress, droughts and floods, including impact of climate change
  • Catchment management and ecosystem services on different scales
  • Large-scale nature-based solutions and biodiversity
  • Water rights, trading and partnerships

Holistic Assessments

  • Life cycle assessment, water efficiency, water footprint, virtual water, etc.
  • Planetary boundaries and science of sustainability
  • Water resource management towards Sustainable Development Goals (SDGs)

Find out more at: https://worldwatercongress.org/


Tuesday, 27 August 2019

What does the Urban Greening Factor mean for London?

The Urban Greening Factor is a major policy initiative coming through the London Plan. Driving green infrastructure can also drive improved water management through green roofs, blue-green roofs, wetlands and other measures in new developments. Adapted from an earlier version posted on the Landscape Institute blog.

Green cover map for London (GLA, 2019)


The Urban Greening Factor is a major policy initiative coming through the London Plan. Samantha Davenport from the Greater London Authority (GLA) LI members at the LI London branch AGM on 2 April to discuss the Urban Greening Factor in her guest presentation Greening the Growing City.

A green city and green infrastructure

London’s status as a green city been supported by protection of green spaces from the 1943 County of London Plan to 1980s integration of conservation areas for habitats into planning policy. This can be seen in the GLA’s green cover map, and increasingly we are looking at the function of this green space and how it can deliver green infrastructure.

The city faces many pressures, including:

  • population growth: an additional 3 million people by 2050, more than the current size of Manchester
  • poor air quality
  • climate change effects on water resources (we will need an additional 400m litres per day by 2040), issues with sewer capacity and flooding, and a 5-6 degree increase in summer and winter temperature averages by the 2050s
The GLA define Green infrastructure as follows:

The network of green spaces, rivers and wetlands (as well as features such as street trees and green roofs) that is planned, designed and managed to deliver a range of benefits, including:


  • healthy living
  • mitigating flooding
  • improving air and water quality
  • cooling the urban environment
  • encouraging walking and cycling enhancing biodiversity and ecological resilience


The GLA’s Green Infrastructure Focus map highlights areas where GI can provide benefits in London.

What is the Urban Greening Factor?

The Urban Greening Factor (UGF) is ‘A tool that evaluates and quantifies the amount and quality of urban greening that a scheme provides to inform decisions about appropriate levels of greening in new developments’. The aims of the UGF include:

  • to accelerate greening of the built environment – making sure London is greener as it grows
  • to ensure better planned, better quality greening interventions that contribute to a functioning GI network.

The UGF is set out in Policy G5 of the Draft New London Plan. It aims to increase green cover and be considered at the beginning of the design and planning for new buildings and developments. This was designed based on evidence from similar schemes that have been implemented internationally and in the UK. (See report.)

The UGF is calculated based on a range of factors in a table for different greening factors (example below). Boroughs can develop their own targets; however, the London Plan recommends a target score of 0.4 for predominantly residential developments, and a target score of 0.3 for predominantly commercial developments. Existing green cover on site that is retained can be counted towards the score, and where this existing green cover is protected for reasons such as biodiversity or as open space other relevant planning policies will continue to apply in addition to the UGF.

Calculation of UGF (GLA, 2019)

Some examples

A range of example case studies were presented at the London AGM. Below is an example of a scheme that had a UGF of 0.26, but with 75% of the roof level surface as extensive green roofs this could be increased to 0.41. Research by the GLA on planning applications shows that to retrofit designs, the most common approach is green roofs; however, if the UGF is considered earlier in planning, some of the wider measures can be implemented.

Example of retroactively applying UGF and options to increase this to developments (GLA, 2019)

The range of quality surface cover types that can help improve UGF scores are outlined below. An example from practice is also provide below with the landscape on the left achieving 0.5 for the perennial planting, versus the more biodiverse rain garden on the right achieving 0.7.

Examples of UGF in practice based on quality: left 0.5; right 0.7

What does the UGF mean for London?

The UGF is likely to be a major driver for landscapes in London. Based on the practical research on planning applications by GLA, considering the UGF up front will provide better outcomes. This supports involving environmental professionals and development of green infrastructure earlier in the planning and design process. Where we can learn from best practice this can be applied in other areas of the country.

A discussion on the UGF followed the presentation by GLA. This recognised that the UGF does not set out what is the right type of greening for a specific location but instead is a tool to support greater inclusion of green infrastructure into new developments in London to help meet targets for green cover across London. There is also an opportunity for LI members to provide feedback to the GLA on how the UGF works in practice. Some members raised concerns about the quality of open and play spaces linked to UGF and the GLA response was that these are still covered by other elements of planning policy in addition to the UGF. Maintenance of green infrastructure was also raised as an issue, where the quality may decrease over time. Currently this isn’t covered by planning but there are mechanisms to fund management of landscapes and green infrastructure through the private rented sector and wider funding sources need to be identified to address this.

Finally: the UK Government has announced that Biodiversity Net Gain will become mandatory in England for new developments. UGF will be delivered on-site and still needs to be met; even if, for biodiversity net gain, a developer is looking to off-site solutions.


Wednesday, 19 June 2019

Integrated approaches needed for water infrastructure resilience

Originally posted on the Landscape Institute website and modified for this website.

Earlier this year, the National Infrastructure Commission (NIC) undertook a consultation as part of its new study into the resilience of the UK’s infrastructure network. The Landscape Institute (LI) submitted its response on 1 April 2019.

Landscapes – and how they are designed, managed, and used by the public – have a major impact on national infrastructure. They affect road, rail, energy, power and communications, water and waste management, and city growth; and these affect our landscapes in turn.

The key landscape-related resilience proposals from the National Infrastructure Assessment (NIA) 2018 included:

  • ensuring resilience to extreme drought through additional supply and reduction of demand
  • a national standard of flood resilience for all communities by 2050 
  • measures to make cities healthier, better designed and more habitable

This blog post summarises some of the points in our response. I also presented on elements of this on day 2 of the Flood and Coast 2019 conference (Wednesday 19 June), as part of the session ‘Implementing the ambition of the 25-year Environment Plan for a climate-resilient society’.


What key resilience questions should the next NIA answer?

The LI response provided key questions, linked back to the NIC Terms of Reference, on topics including:

  • the definition of resilience
  • public perceptions, behaviours and community involvement in resilient infrastructure
  • the multiple benefits from green infrastructure options and the skills and types of professional expertise needed to deliver these

What issues should we prioritise?

The response focussed on key issues linked to integrated approaches that can support resilience:

  • Sustainable Drainage Systems (SuDS). 96% of local authorities report that the quality of planning submissions for SuDS are either ‘mixed’ or ‘inadequate’. And as of 2017, 25% of local authorities had no formal SuDS policies in place, nor any immediate plans to implement any.
  • Integrated Water Management. With pressures from drought also increasing, particularly in the South East and East of England, water reuse via SuDS can provide an alternative and more resilient decentralised water supply option. However, there remain barriers to developers implementing these approaches.
  • Environment Net Gain. There is a risk to large-scale infrastructure proposals if wider environmental and social benefits around flooding, drought and biodiversity are not considered (e.g. if focus is on biodiversity only) as these benefits may not be realised.

What are the barriers?

And are there any examples of where barriers to resilience issues, arising from sectoral dependencies or other causes, have been addressed or overcome?

The LI response identified the issue of those responsible for infrastructure working in silos. This set out the policy changes suggested in our recent survey of local authorities on SuDS. There are two case studies that we put forward where sectoral interdependencies have been overcome:

  • Transitioning to Water-Sensitive Urban Design in Australia. Improved working between water utilities, local and state governments has been key to implementation of SuDS and integrated water management issues in cities such as Melbourne.
  • Managing the Urban Heat Island in Singapore. A ‘whole of government’ approach has brought together many areas including energy policy, transport, building standards, planning and public health. There are strong links between this programme and requirements for blue-green infrastructure in Singapore.


Monday, 27 August 2018

Freeze/ thaw as a resilience issue linked to customer participation and water efficiency

Originally posted on WATEF Network 1/08/2018
https://www.watefnetwork.co.uk/blog-894


"We effectively faced a major drought occurring within the space of several days – we need to have much greater engagement with customers in order to deal with all resilience issues and water efficiency is a key aspect of this."

Background and impacts

More than 20,000 homes in London were without water in March 2018 due to an extreme weather event. Southern Water reported loss of supply to around 1,000 homes. Around 3,500 homes in Wales lost water supply and many parts of Birmingham, the West Midlands and Staffordshire (BBC News).

This network related event effectively led to the need for drought level responses. Londoners were told to “use as little water as possible” and to “take shorter showers”. Southern Water urged customers to “only use the water you absolutely must” (BBC News).

Ofwat recently released their report on the incident covering assessment, planning and preparation, handling of incidents, communications and support, and ongoing support. We’ve suggested it should also look at the role of water retailers in working with customers and wholesale companies during this period. Research by the Consumer Council for Water (CCWater) in seven of the worst affected areas indicates that 40% of customers impacted received no communication from their water company during the incident. They identified better performance by those companies who actively communicated with local resilience forums in advance.


Although water companies are moving beyond just being in contact with customers when there is a bill or a problem, this incident further illustrated the need for greater effort in this area if we want customer “participation” before and during resilience incidents.

This blog post sets out out thoughts on communications and support and proposes that the problems in this area reflect wider industry issues, which this intense resilience incident could have benefitted from: 

  • A much closer relationship with customers could enable a better understanding of vulnerable users but also how to help/encourage them to prepare, and then to provide support to them.
  • Greater communication up-front and behaviour change could protect pipes/ reduce water use
  • Increased and sustained baseline communication on water resources, networks and how to save water could enable more effective customer participation during future resilience issues. Water efficiency was a key message to reduce demand from the system in order to maintain supplies.

Moving towards customer participation

The Waterwise Water Efficiency Strategy for the UK highlighted that consistent and co-ordinated messages are important for effective communication and vital to developing a water-saving culture. But there is a lack of consistent messaging and little coordinated or collaborative action between water companies. The 2012 drought highlighted the importance and benefits of having joined-up messaging across the sector (as did the recent freeze-thaw incident).


How does this link to the 2012 drought?

There are many lessons that can be learnt from the 2012 drought that apply to future drought (which has been looming recently in the South East of England) or other resilience issues.

Some of the key findings from a Waterwise and WWF report relevant to this event are: 

  • Joint working and messaging was really important during the 2012 drought – how could this have been better coordinated by water companies in the freeze/thaw event, particularly in London?
  • Having agreed messages and a single point of contact helped in the 2012 drought – can we have these prepared in advance for a range of future resilience issues?
  • There was a lot of stakeholder engagement by the industry, however this was starting from a fairly low base with many sectors and there is a need for much earlier and better stakeholder engagement by the water industry – this finding reflects the low level of ongoing engagement around water resources in general and addressing this would help in the freeze-thaw also. Engaging with resilience forums is a key action suggested by Ofwat.

  • There is a need for quasi-Governmental bodies to play a larger role in engaging with the public on wider water issues, these include bodies such as the Met Office, British Geological Survey (BGS) and the Research Councils – how could these bodies have helped with forecasting and communications during the incident?

  • Despite the company activity the customer research shows that people perceived the reason for the drought to be water company leakage. This highlights that there is a need to increase general knowledge around water, as there is a lack of understanding of water processes amongst the public – a survey following this incident may also find a lack of understanding of water networks and that there is some baseline risk that can’t be prevented. How can this better be communicated?

  • There clearly needs to be a national ongoing campaign to promote water issues and water efficiency, so that there is a background of understanding in advance of the next drought – this ongoing communication would help as customers would already be engaged during resilience issues.

  • Water companies should look at the option of using mass media such as television or direct mail during future droughts which would enable them to provide more in depth information about the hydrology of the drought. There is a lot of academic research that shows the potential for instilling pro environmental activity through normalised behaviour. However this requires a baseline of understanding and more information than is currently provided, the current information on water resources and water efficiency is passive and there is a need for proactive provision of information – it will be really important to understand the most effective modes of communication on an ongoing basis but also during resilience events. It shouldn’t just be social media.
 A review undertaken for UKWIR on understanding the impacts of temporary use benefits identified:

  •  There was a missed opportunity in terms of wider collaboration. For instance Thames shared its copy and images with other water companies but the use of other logos on the images (other water companies, Met Office, EA, and NGOs) would probably have added credibility and showed that this was a wider issue - how can water companies engage with other trusted bodies during resilience events? Should there have been communications at the city level in London, for example?
  • There urgently needs to be a well-resourced and constantly updated industry source of information on water resources (this could be web-based) – this communication would help ongoing customer engagement and participation.
  • Television was the primary source of information on the drought for customers, however clear and concise geographical splits should be communicated through the media to explain where TUB restrictions are imposed – this finding supports the need for mass communication, which is something water companies held back from during this incident.
  • Water companies should notify those non-domestic sectors that might be affected by potential drought restrictions as early as possible – customers would prefer to know if they are going to be affected, however some water companies didn’t communicate early or the extent of the problems as they didn’t want to cause panic. Water companies need to better understand the desires of their customers for communication during these incidents.
  • Water company websites, although not identified as a key source of information, saw a huge upturn in visitor numbers during the TUBs. Messages and access to further information should be easily accessible from the landing page of the website, and data should be updated on a regular basis (even outside of drought periods) – we know that some water company websites couldn’t handle the number of visits during this incident and this needs to be reviewed.

What can we learn for water efficiency and what research may be useful?

Although this was an extreme incident that happened in a short amount of time it does raise questions about the industry’s overall engagement with customers and the ability to deal with a more prolonged incident such as drought effectively. Many of the recommendations from the 2012 drought haven’t been taken forward, however Waterwise and our Leadership Group on Water Efficiency and Customer Participation is looking to take forward a national communications platform that could help with longer term customer engagement.

Some key areas for research to support future resilience incidents linked to water resources are: 

  • Customer survey on communications methods and channels before, during and after the freeze/thaw incident. This should use a similar approach to the CCWater and following UKWIR surveys used to understand impacts in the 2012 drought 
  • Segmentation and customer research in order to target messaging about water efficiency, preparing for freeze/thaw by lagging pipes and opening valves etc
  • Research on developing communications and utilising national platforms to enable customers to participate in reducing demand over the long term, responding during an emergency and to help them work with water companies to get water when supplies are cut off
  • What are the roles and responsibilities of retailers for supporting water customer resilience?

Waterwise are working with stakeholders across the sector to answer these question in delivering our Water Efficiency Strategy for the UK.


Tuesday, 27 February 2018

Water use in Tokyo

Tokyo is currently the largest city in the World with a population of over 38 million people (greater Tokyo area - 13 million in the city itself). As a megacity, Tokyo experiences a range of sustainability pressures and water management is no exception. I was recently in Tokyo for a meeting to develop the International Water Association World Water Congress programme, which is being held in September 2018. Water use and water efficiency will be a key element of the programme linked to resilience issues. I visited the Tokyo Sewerage Museum "Rainbow" to learn more about water management in the city.


Where is water used in households in Tokyo?

Based on a survey by the Bureau of Waterworks in the Tokyo Metropolitan Government, average water use per person is about 230 litres per day. The highest use is flushing toilets (64l), followed by taking a bath or shower (55l) and cooking and washing dishes (53l).

Average water use in Tokyo is 230 litres per person per day

The museum has an interactive household where you can actively use water and see how it drains away in the system. You can see how much water is used when you flush a toilet for example.


Water demand in Tokyo has fluctuated with economic growth and population increase. It is expected to peak between 2018 and 2027 at a maximum of 6 million m3 per day (Outline of the Tokyo Waterworks Bureau).

How does this compare internationally?

The International Water Association collects statistics on a range of issues, including household water use. The latest figures from 2014 are in the figure below, where Tokyo is within the top third of consumption.


Average water consumption in England, UK, is around 140 litres per person per day. The EST At Home with Water report outlines water use for the UK based on a water and energy calculator. This results from this report showed showering to be the largest water user (25%) followed by toilet flushing and then other (cold tap) use.


London is the one of two cities in Europe in the top 50 worldwide by population. Current consumption in London is on average 146 l/p/d. Thames Water is forecasting a deficit in supply compared with demand of 864 million litres per day by 2100.


From the draft Water Resources Management Plan for Thames Water we can also compare where water is used in the home. The figures for unmeasured and measured (metered) households in London are below. For metered homes (the most comparable), the largest water use is personal washing followed by toilet flushing.


How water efficient is Tokyo?

Comparing water efficiency based on per capita consumption alone is too simplistic as there are many different approaches to calculation and it doesn't account for wider factors that explain water use within cities.

The International Water Association Efficient Urban Water Management Specialist Group has been undertaking research on comparing water efficiency in cities over the past few years. I wrote a blog post about it here. When using a wider range of metrics as in the Sustainable Cities Water Index 2016, Tokyo is actually rated number 6, whilst London is rated 34. This can be attributed to greater metering and water recycling in Tokyo, even though the city has a higher PCC.

There is potential to reduce consumption linked to toilet flushing and showering/ bathing in Tokyo. This could come from improved efficiency of new devices, retrofit programmes and behaviour change. The Bureau of Waterworks states that they carry out a range of PR activities on concrete actions households can take to reduce consumption. They have also required manufacturers to develop and promote water efficient devices (Stable Supply of Potable Delicious Water).

Join the conversation on water efficiency through the IWA


The World Water Congress will take place on 16-21 September 2018. Come and learn more about water use in Tokyo, water efficiency, resilience and drought management. Super earlybird registration is open until 30 March!

We are also accepting abstracts for IWA Efficient 2018 until 30th April 2018. This is the major international conference on efficient urban water management and will be held in Manila.


Monday, 12 February 2018

Walking the WSUD way in Melbourne

I wrote this blog post a while ago after a trip to Australia in 2016 but found it recently and thought it might be inspirational for those looking at solutions that can solve drought and flood risk issues.

Why take a WSUD Walking tour?

Every holiday needs a good walking tour, especially in a city such as Melbourne. Even better is a water themed walking tour and the City of Melbourne have several self guided tours on their website related to Water Sensitive Urban Design (WSUD).

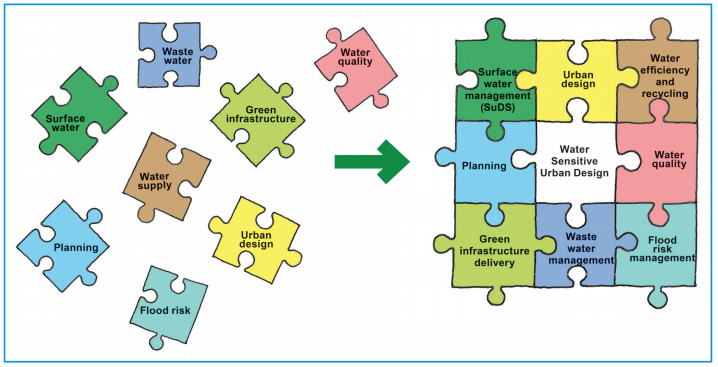
WSUD gained in prominence as a term in Australia from the 1990s and can broadly be defined as “an approach to the planning and design of urban environments that supports healthy ecosystems, lifestyles and livelihoods through smart management of all our waters”. The WSUD scoping study for the UK presents this as the pieces of the puzzle coming together and in-practice getting first conversations started around integration is key. Linked to this is the need for evidence to support WSUD approaches and demonstrators 
Figure 1: WSUD as a holistic approach (CIRIA, 2013)


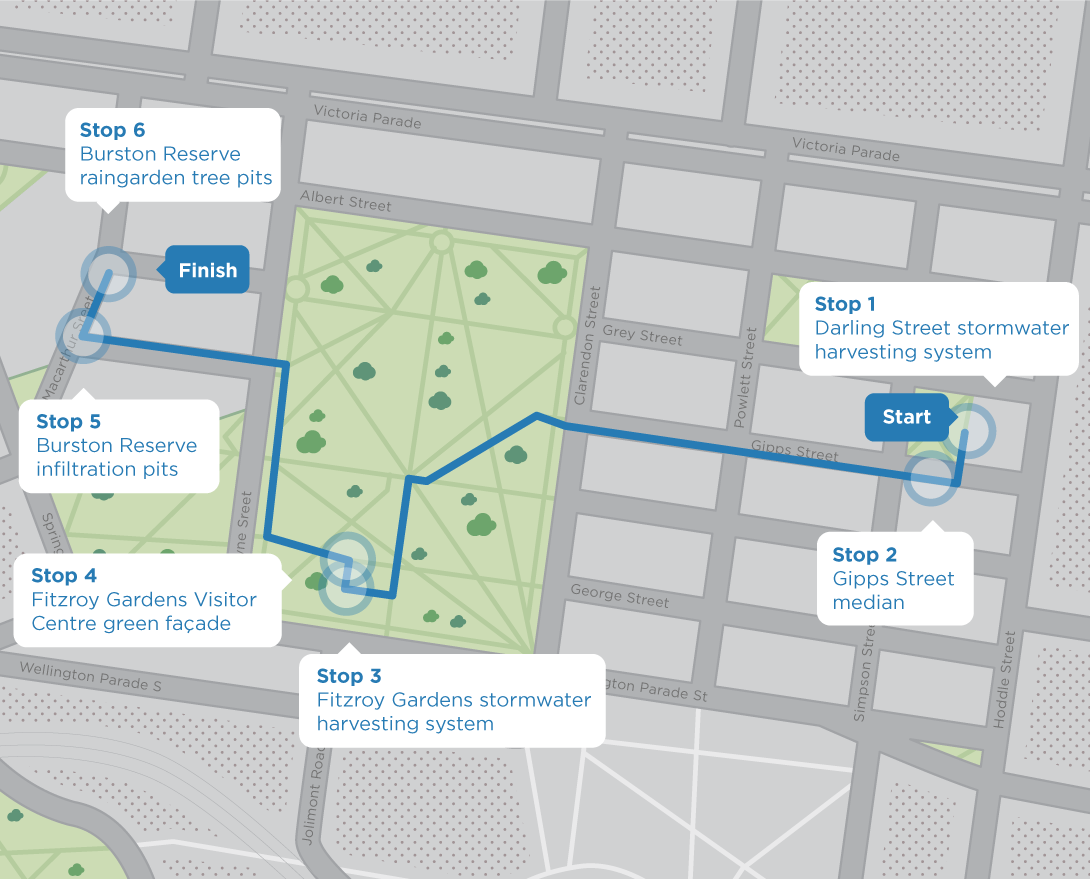
Staying in the inner suburb of Richmond provided the perfect starting point for 2.2km long East Melbourne Walking Tour. In this blog I provide thoughts on the WSUD examples in Melbourne and implications for the UK. In the UK WSUD is often talked about primarily in the context of reducing surface flooding risk, however the stops on this walking tour mainly focussed on reducing potable water use/ resilience, water quality improvement and groundwater issues.

Stops on the way

12981-CoM-East-Melbourne-tour-MAP-1090px.png
Figure 2: East Melbourne WSUD Walking Tour

Stop 1: Stormwater harvesting at Darling Street

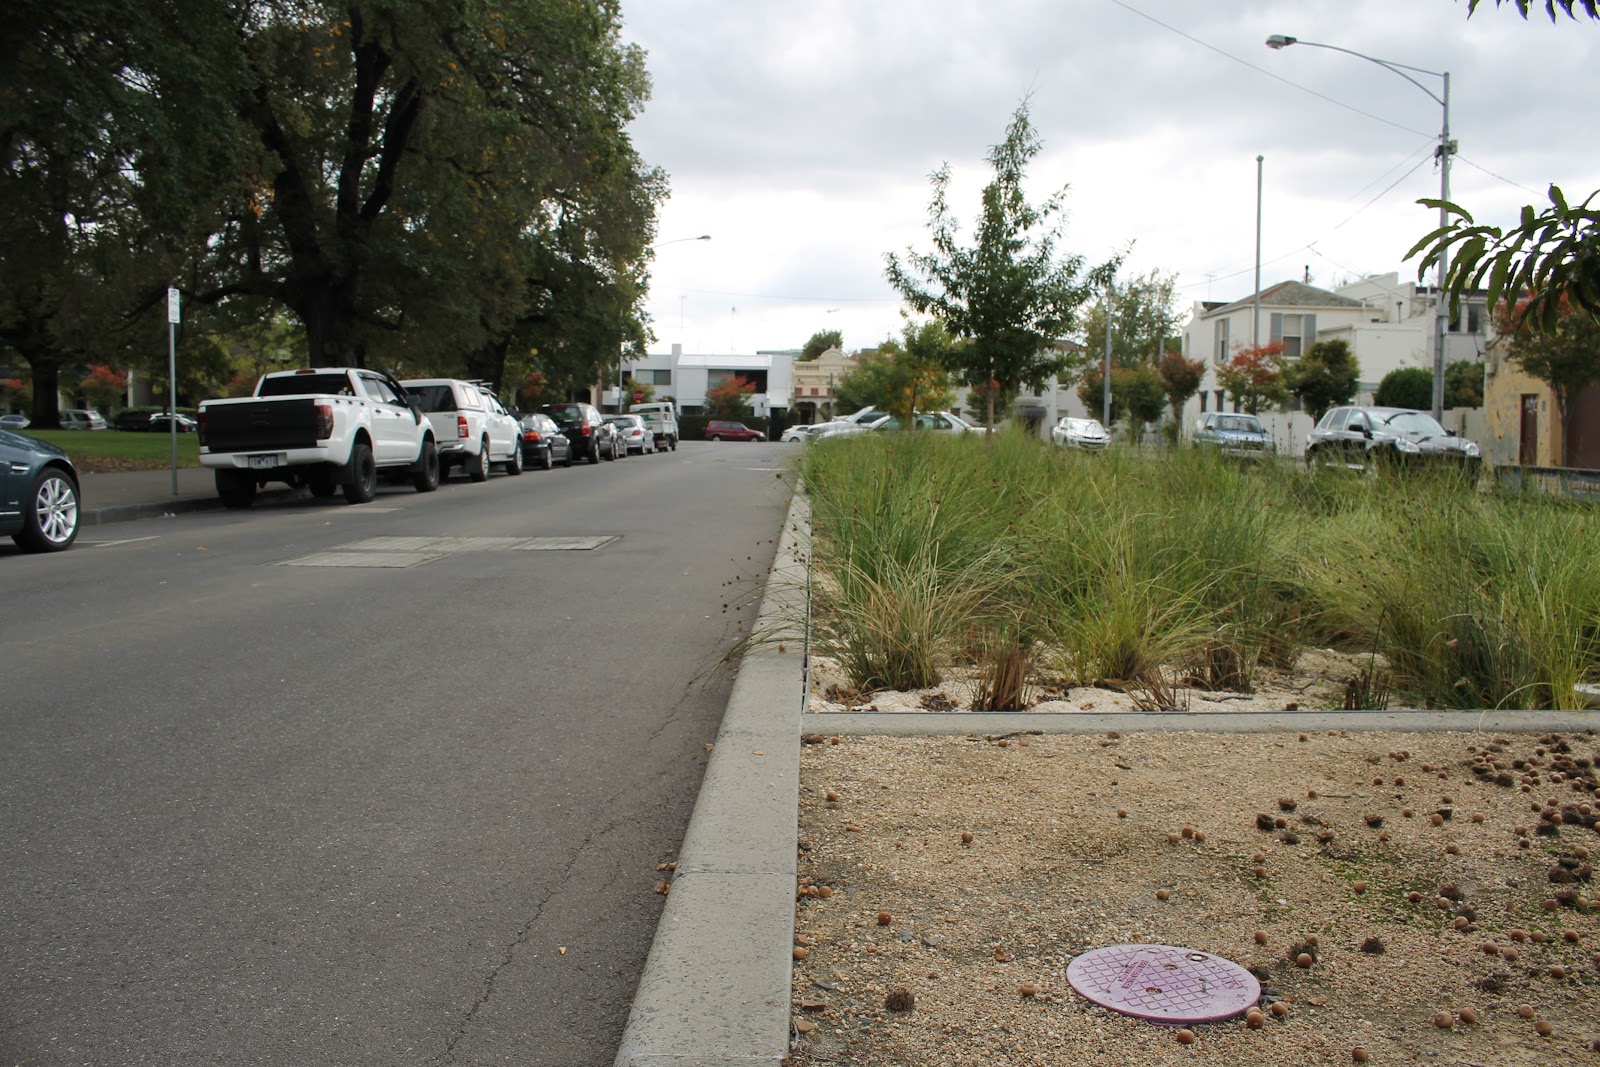
The stormwater harvesting system beneath Darling Street provides treated stormwater to irrigate neighbouring parks and median strips. This was the first stormwater harvesting system constructed in the City of Melbourne and is well integrated into the streetscape. The bioretention systems at street level provide biological treatment in addition to the pollutant traps, sedimentation chambers, and UV treatment belowground. The project made use of the opportunity of an existing local streetscape upgrade to trial a new approach. 

In context, watering restrictions during the Millennium Drought resulted in many tree deaths and impacts on usefulness of parks and recreation spaces. It is estimated that 23% of the city's tree population will be lost by 2020. This example demonstrates use of WSUD for reducing water use and protecting the wider benefits of parks and recreational spaces as well as managing stormwater.
IMG_9633.jpg
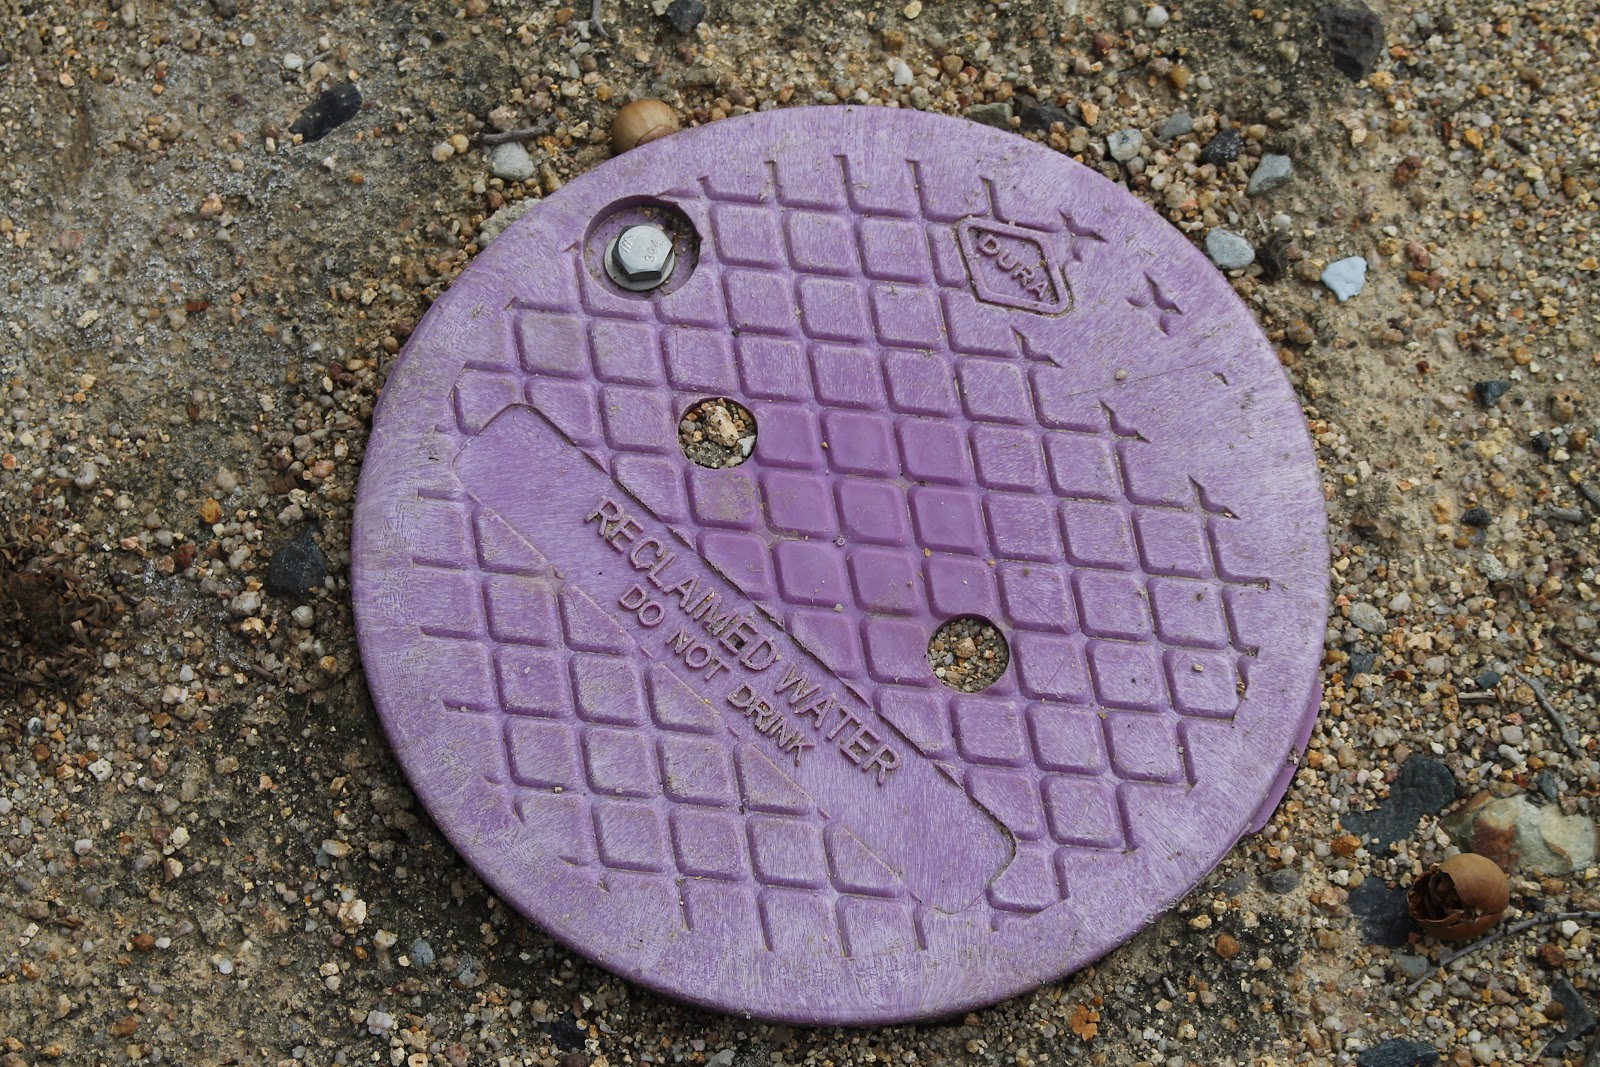
Figure 3: Recycled Water and biofilter bed at Darling Street

Stop 2: Gipps Street median

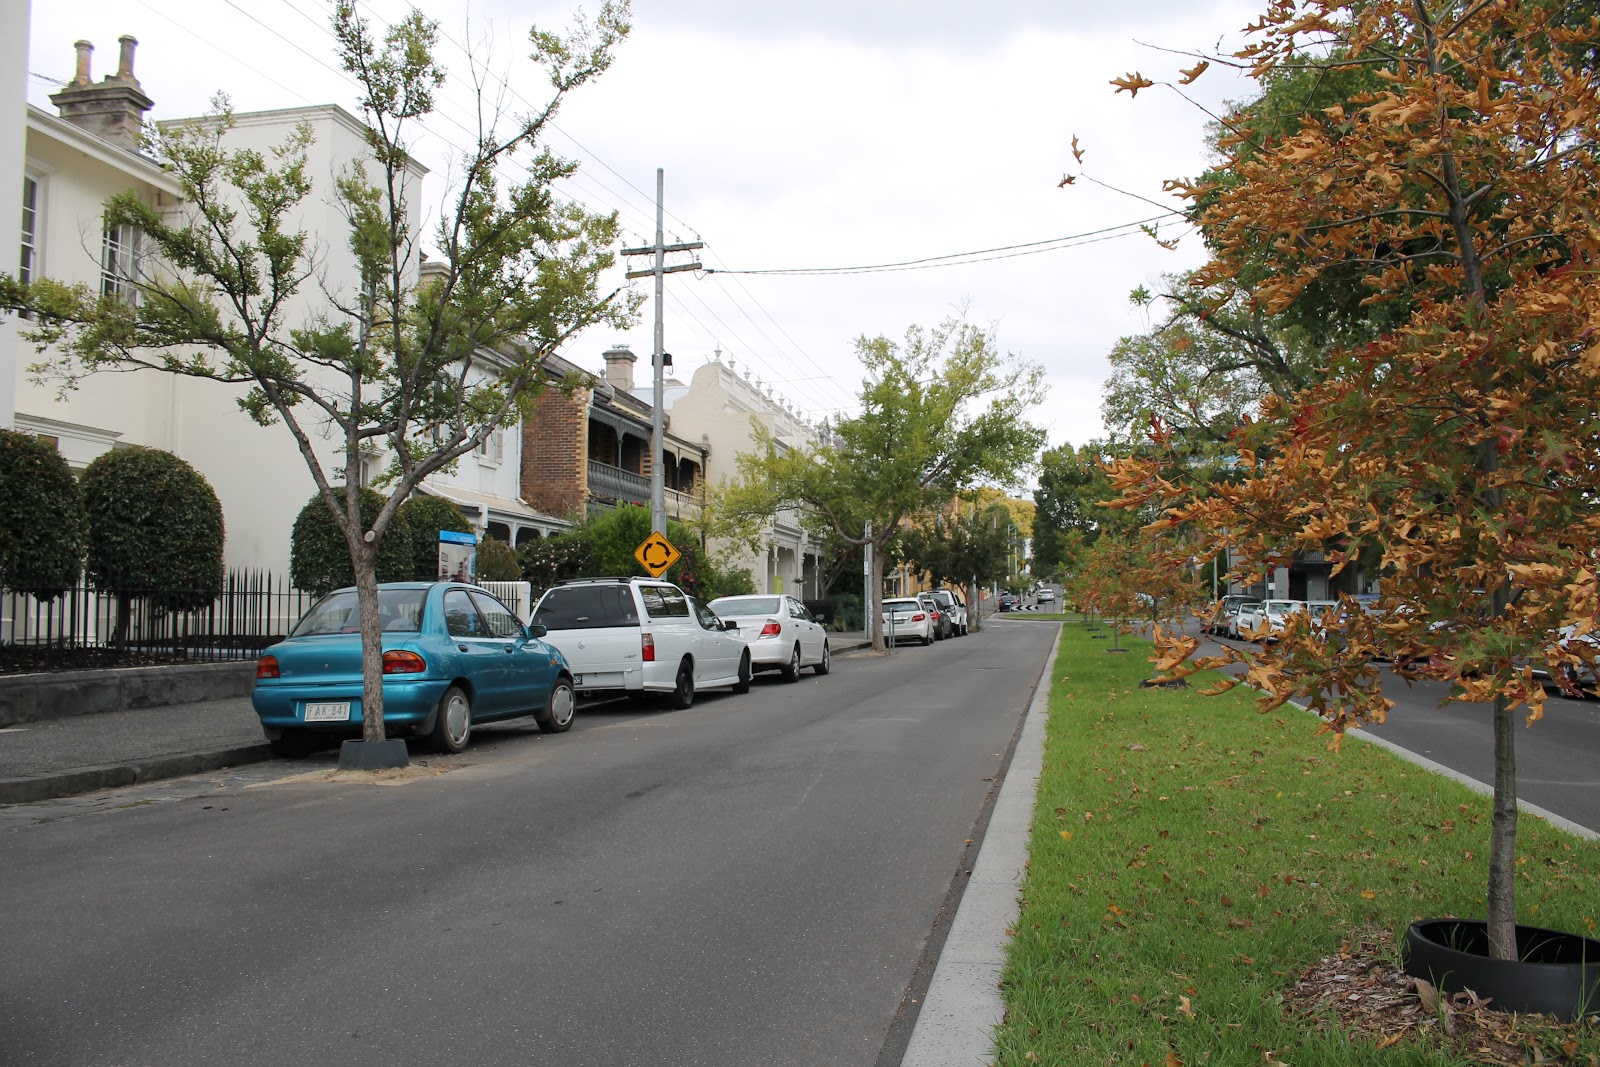
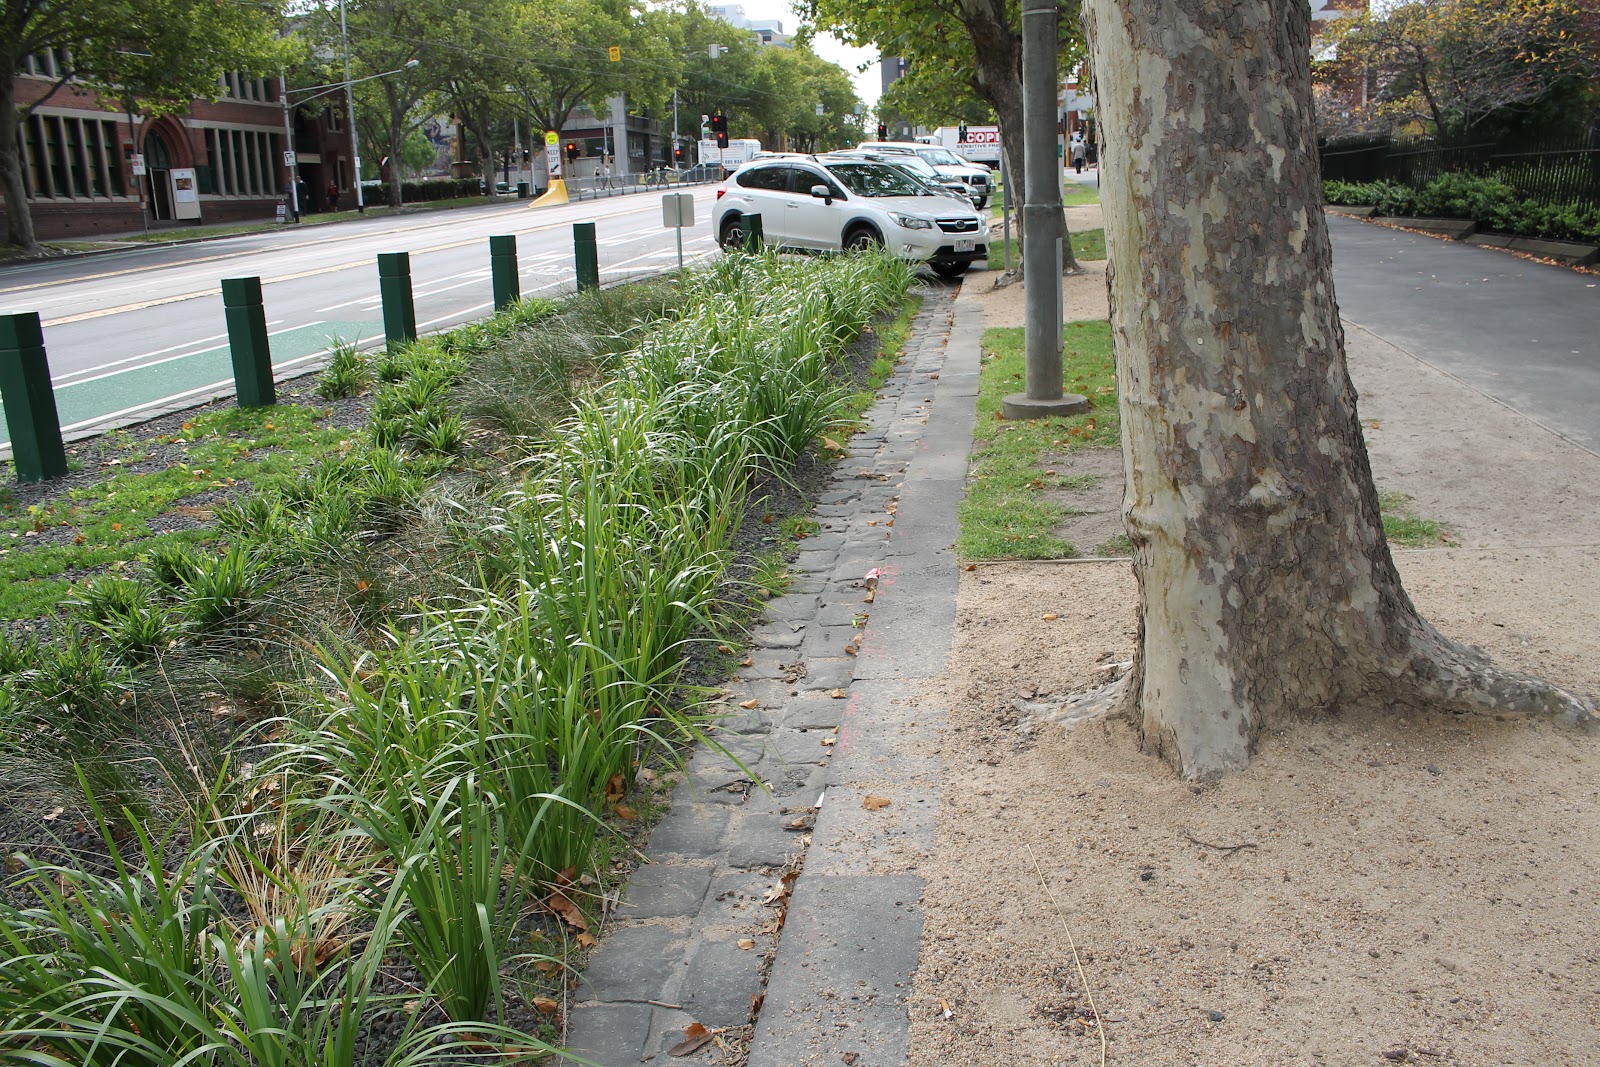
This project was focussed on reducing issues from a high watertable and waterlogged soils. To address these issues a median strip was developed with train that are passively watered by excess water from the root system of footpath trees.

With a focus on groundwater management this stop demonstrates that WSUD is not just about surface water management and flooding issues.

Figure 4: Excess water from the street trees by the curb drains into the central median strip to reduce waterlogging


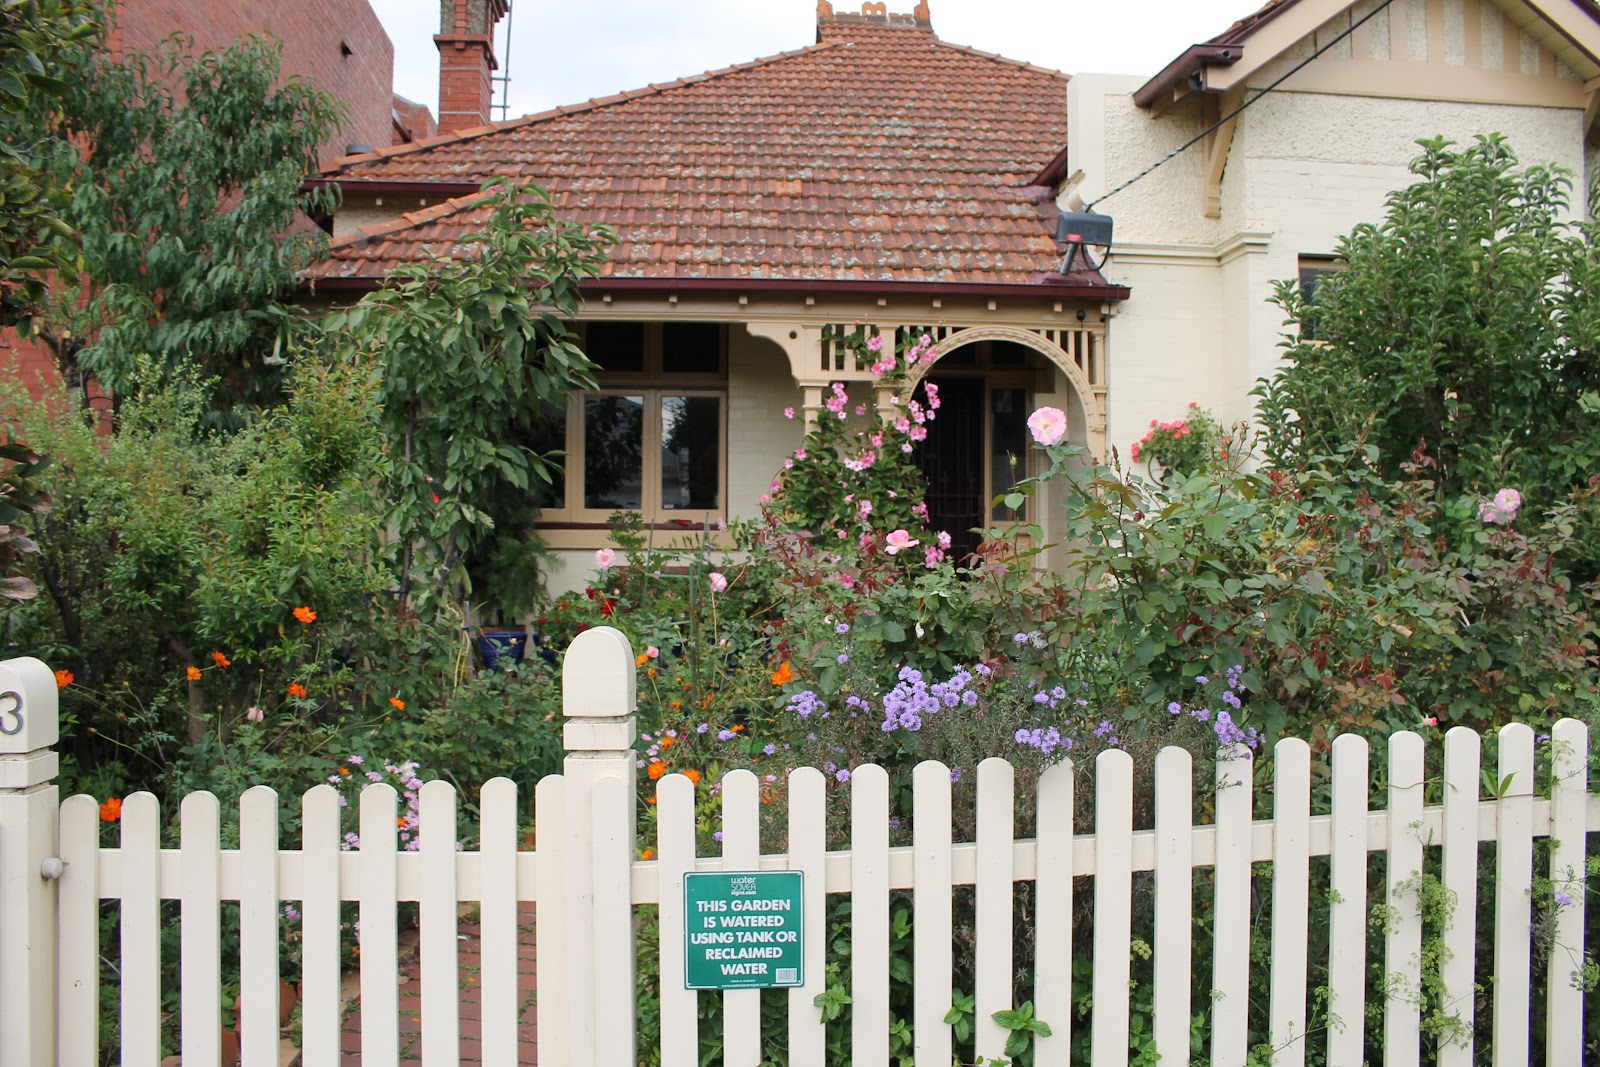
Although the system isn’t very visible in some ways it was interesting to see a local home that has also embraced use of rainwater and reclaimed water for their garden.

Figure 5: Local gardeners also using recycled water

Stop 3: Fitzroy Gardens Visitor Centre

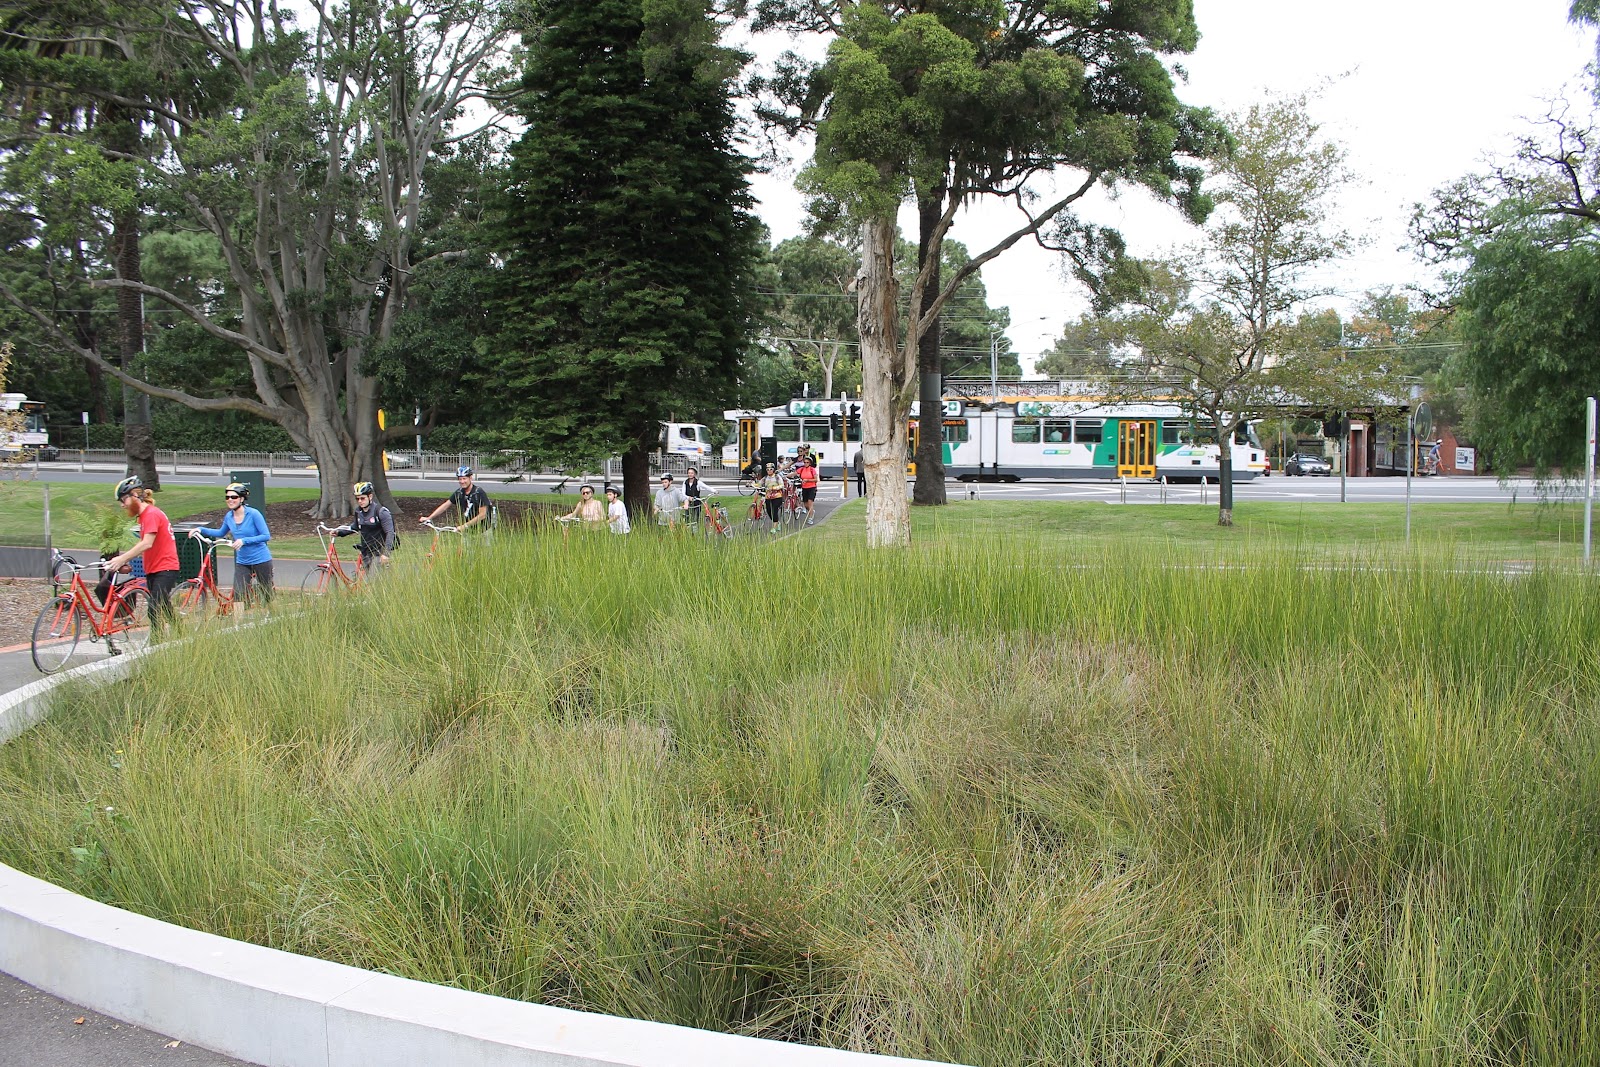
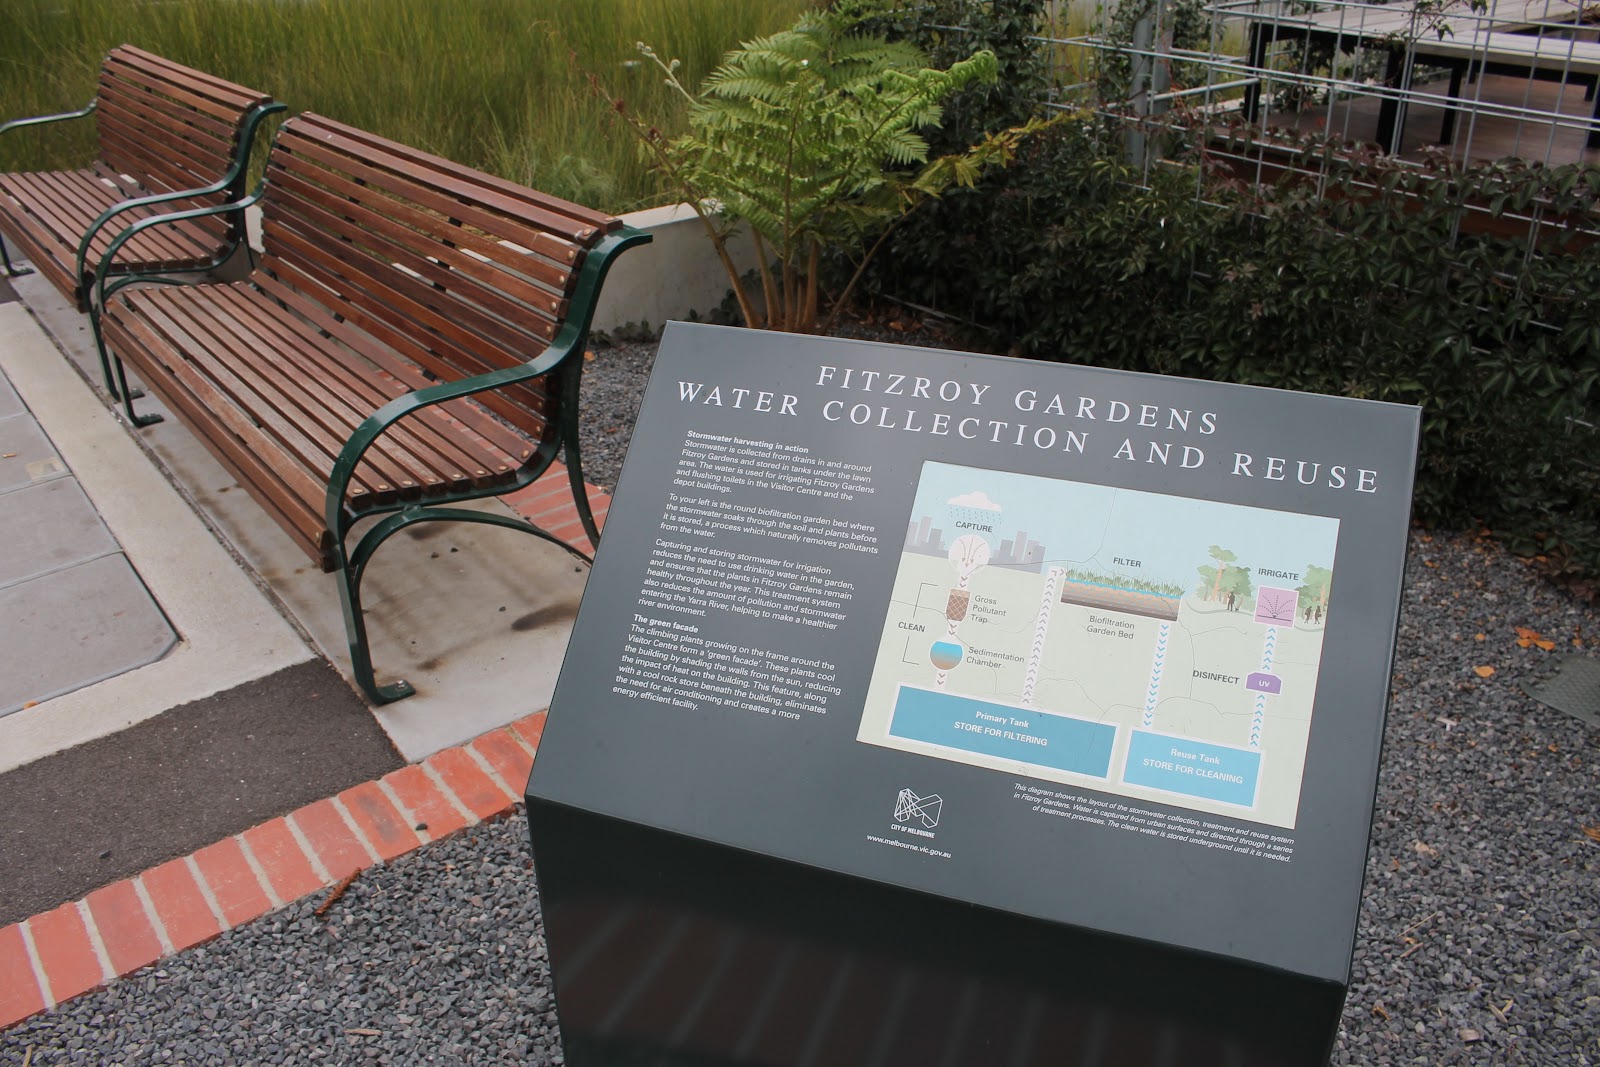
Fitzroy Gardens is home to Captain Cook’s house (imported from the UK) and to a much larger stormwater harvesting system. The surrounding 67-hectare catchment drains to this natural low point and stormwater has now been diverted here for treatment. This system follows a similar treatment train to Stop 2: pollutant traps and sedimentation; primary holding tank; biofiltration beds; reuse tank; then finally, UV treatment before use in irrigation.

Approaching the site on the walking tour the scheme isn’t particularly visible, however you can distinguish the area where the underground tanks are sited. The signage for the scheme is quite visible by the visitors centre and there are park benches by the bioretention beds that integrate an amenity element. The scheme saves approximately 70 million litres of drinking water per year from being used for irrigation, provides reliable irrigation water for the heritage gardens and reduces pollutant loads from entering the Yarra River and Port Phillip Bay.

Water recycling and decentralised water solutions can cause concerns around carbon emissions. For this scheme the initial intention was to install renewable energy systems to cover consumption energy use from pumping, however a change in council policy lead to an energy audit and offsetting approach as part of a wider Carbon Neutrality approach for the city.

Figure 6: Biofiltration beds at Fitzroy gardens
Figure 7: Educational signage at Fitzroy Garden
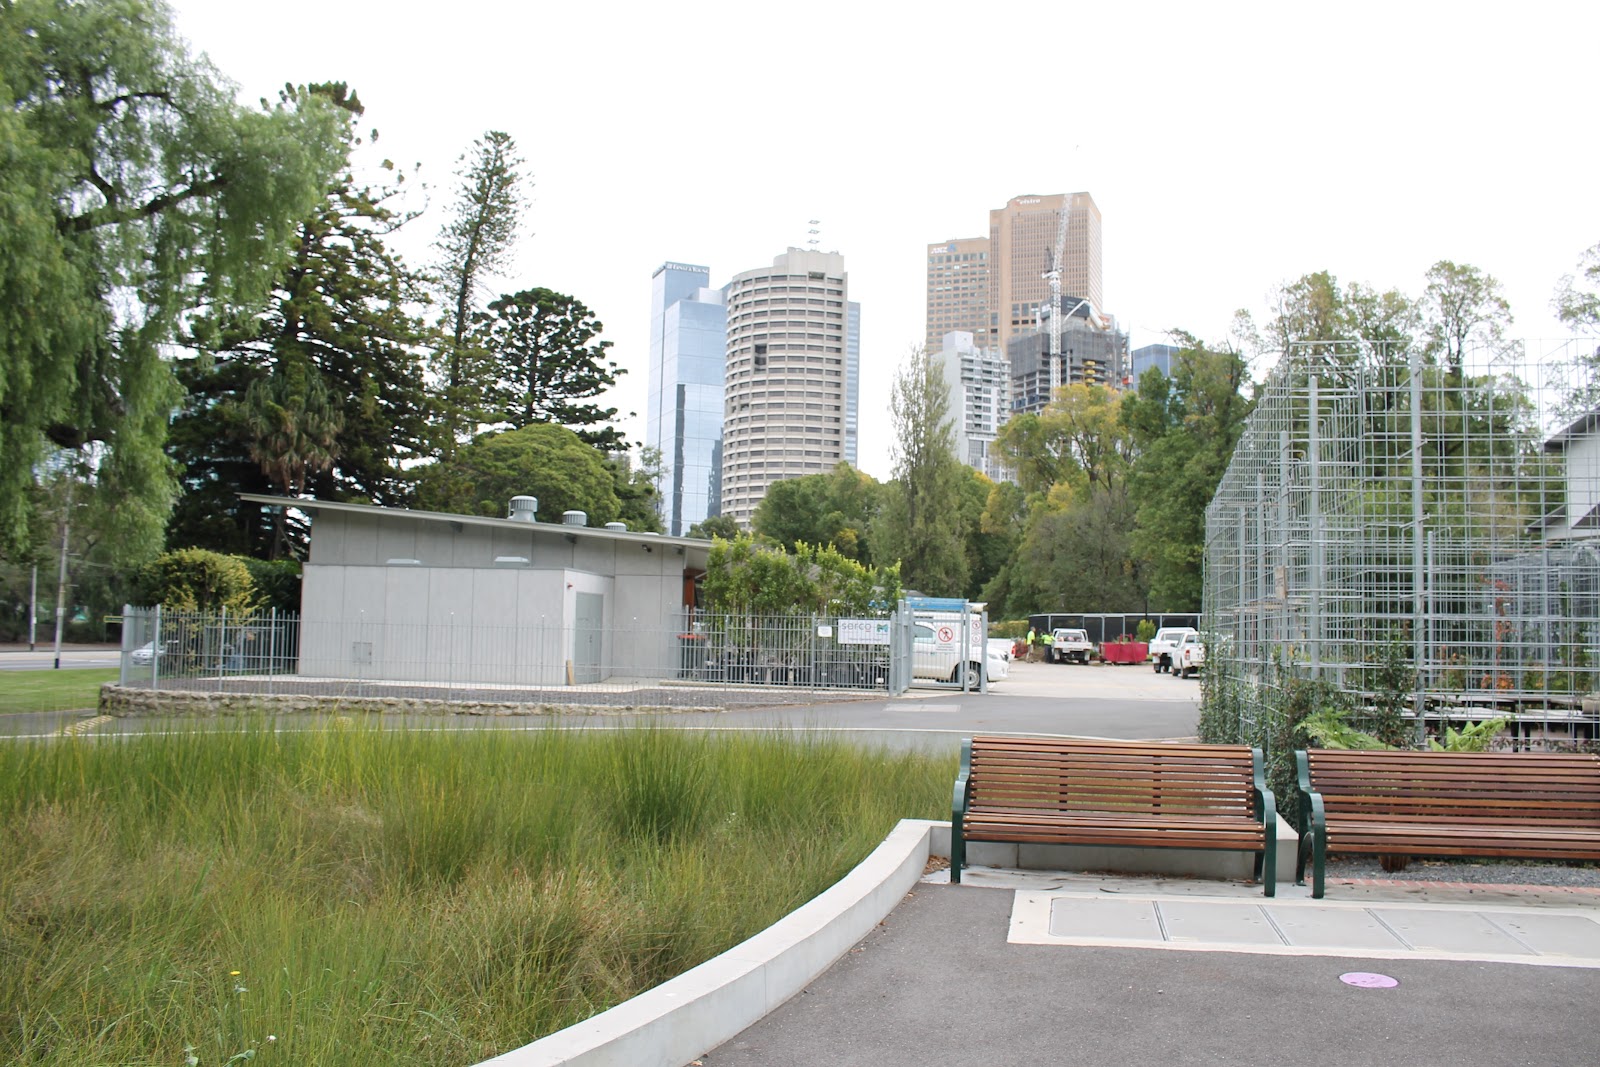
Figure 8: Biofiltration bed with City of Melbourne CBD in background


Stop 4: Green facade at the Fitzroy Gardens Visitor Centre

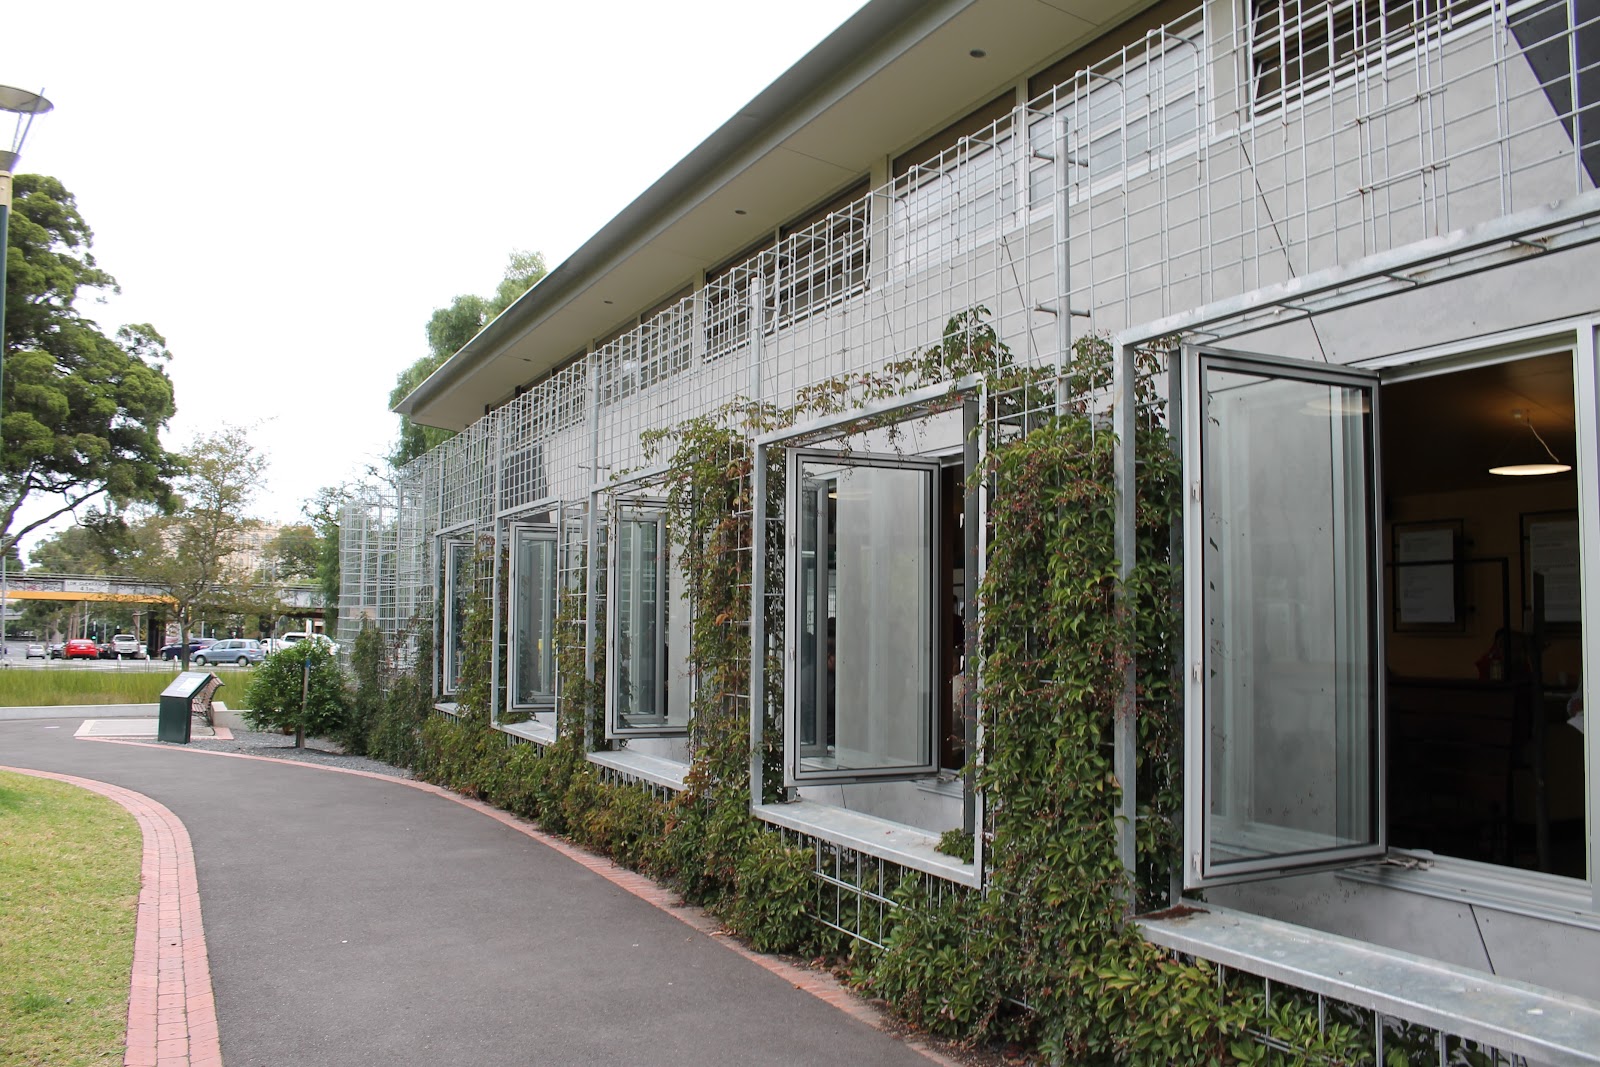
A green facade was installed to help the new visitors centre blend into the surroundings. This was combined with sprays by the windows to both shade the building and reduce the temperature of air drawn in through windows and doors.

On the date of our visit it looked like the facade had grown compared with installation photos, however it hasn’t covered the full area yet and it is questionable how much cooling is being provided.


Figure 9: Green facade at Fitzroy garden visitors centre

Stop 5 & 6: Burston Reserve infiltration pits and raingarden tree pits

For the last two stops it was harder to distinguish the tree infiltration pits and there was no signage. The raingarden on Macarthur street is visible and along with the tree pits functions to improve water quality by filtering nitrogen, phosphorus and oils.

Figure 10: Tree infiltration pits


Figure 11: Raingarden

WSUD walks and opportunities for other cities

The walking tour was a great way to see Melbourne and to learn more about the WSUD case studies. Being able to access this via a PDF and the website provided flexibility for overseas visitors to be able to access the information on a smartphone (i.e. you don't need access to mobile data).

Other cities can definitely learn from this. Having recently travelled to Malmo, Sweden (something for another blog post) - it is much harder to find information from reports and presentation whilst exploring an area. In Portland there were good maps but we ran out of time to follow in detail any of the walking tours (link to GI tours).

Demonstrator projects are now being seen as an important step in policy transitions towards more integrated water management in the UK. In addition to site visits with professional bodies it would definitely help to have similar self-guided walking tours made available. For example, a recent walking tour of green infrastructure in London could have been written up for other to follow and share the learning. There is a map of SuDS in London available from GLA, however these sites could be linked together to create an informative walking tour. Perhaps this is something that Susdrain can pick up with partners in the UK from a SuDS perspective.

Major environmental challenges for the water sector

 A quick post on some of the major environmental challenges for the water sector: 1. Climate change – water is a key medium through which we...